
4tools · check · make · fill in · inverse
Proportion Table Calculator k, y = kx & graph
Check whether a table of x and y values is proportional, find the constant of proportionality and the equation y = kx, fill in missing values and see the line on a graph.
Proportion Table Calculator: Check, Complete and Graph Proportional Tables
This free proportion table calculator works with tables of x and y values. It tells you whether a table shows a proportional relationship, finds the constant of proportionality k, writes the equation y = kx, fills in any missing values and draws the graph, so you can see the straight line through the origin. People also search for it as a proportional table calculator, a proportional relationship table calculator or a constant of proportionality table calculator. It does all of those jobs.
It has four tabs:
- Check a Table tests up to six x, y pairs. If every y ÷ x gives the same number, the table is proportional, and the calculator fills any empty boxes from k.
- Make a Table builds a table of y = kx from a constant k or from one known pair, with any starting value, step and number of rows, and plots the graph.
- Fill Missing Values completes a two-row ratio table (for example, apples and cost) from one complete column, and shows the multiplier for every column.
- Inverse Table checks whether x × y stays the same, which means y is inversely proportional to x. It fills the gaps from y = k ÷ x and draws the curve.
Need to solve a single proportion such as 3/4 = x/20, or a percent or similar-shape problem? Use the proportion calculator on the home page.
How to Use the Proportion Table Calculator
- Choose a tab. Use Check a Table when you already have values, Make a Table when you know k or one pair, Fill Missing Values for a ratio table with labels, and Inverse Table when one quantity falls as the other rises.
- Type the values into the x and y boxes. Fractions such as 3/4 and mixed numbers such as 1 1/2 work, and so do decimals.
- Leave a box empty in any row you want the calculator to fill.
- Press Calculate. You’ll see the verdict (proportional or not), a table with a y ÷ x (or x × y) column, the graph and the step-by-step working.
The calculator highlights every value it fills in, so you can tell your numbers from its answers at a glance. Tap Show an example on any tab to see a finished table straight away.
What each tab tells you
| Tab | You enter | You get |
|---|---|---|
| Check a Table | Up to 6 x, y pairs, some with gaps | Proportional or not, k, y = kx, filled gaps, graph |
| Make a Table | k, or one x, y pair, plus start, step and rows | A full table of y = kx and its graph |
| Fill Missing Values | A labelled ratio table with gaps | Every missing value and the multiplier for each column |
| Inverse Table | Up to 6 x, y pairs | Inverse or not, k = x × y, y = k ÷ x, filled gaps, curve |
Walkthrough: checking a table step by step
Say your worksheet shows hours and earnings: (2, 24), (3, 36), (5, ?) and (?, 84).
- Open Check a Table.
- Type 2 and 24 in the first row, 3 and 36 in the second, 5 in the third x box, and 84 in the fourth y box.
- Press Calculate.
- The calculator divides 24 ÷ 2 and 36 ÷ 3, finds 12 both times, and reports proportional, k = 12, y = 12x.
- It fills the gaps: 12 × 5 = 60, and 84 ÷ 12 = 7.
- The graph shows all four points on one line through (0, 0).
The steps panel lists every division and multiplication, so you can copy the working into your homework.
What Is a Proportional Relationship?
Two quantities have a proportional relationship when one is always the same multiple of the other. If you buy apples at 2 each, the cost is always 2 times the number of apples. Buy 0 apples and you pay 0. Buy twice as many and you pay twice as much. That fixed multiple, 2 here, is the constant of proportionality.
In algebra, every proportional relationship fits one simple equation:
y = kx
Here x is the input (apples), y is the output (cost) and k is the constant (price per apple). A table, an equation and a graph are just three ways to show the same relationship.
What Is a Proportional Relationship in a Table?
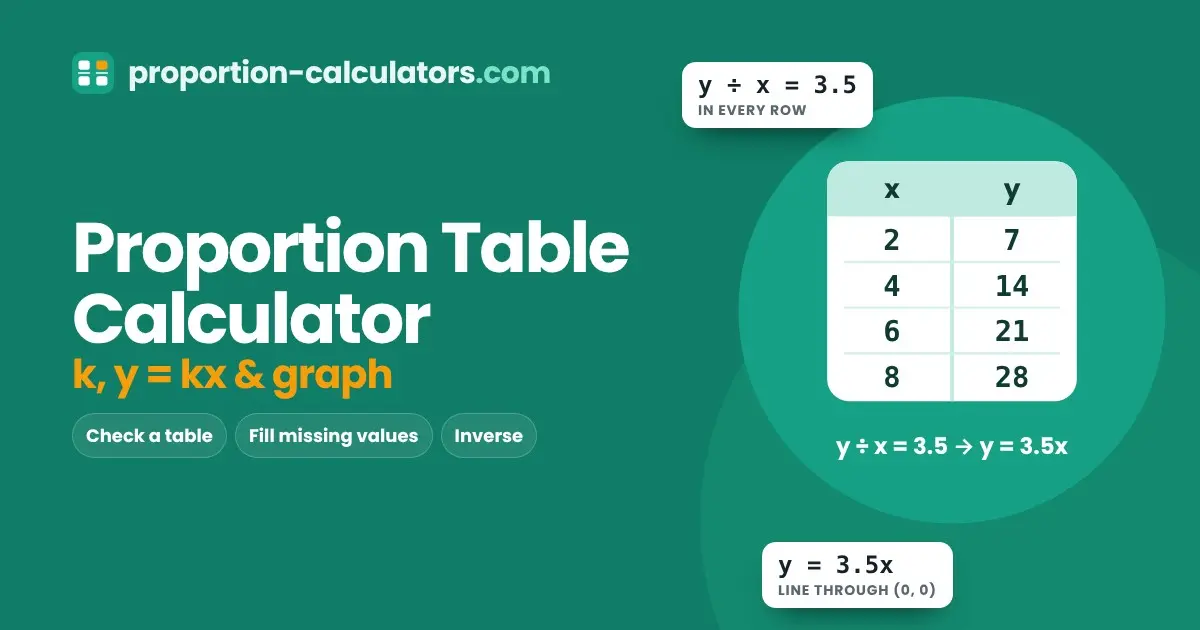
A table of values shows a proportional relationship when every y value is the same multiple of its x value. Dividing y by x in each row always gives the same number, called the constant of proportionality, usually written k.
| x | y | y ÷ x |
|---|---|---|
| 2 | 7 | 3.5 |
| 4 | 14 | 3.5 |
| 5 | 17.5 | 3.5 |
| 8 | 28 | 3.5 |
Every row gives 3.5, so the table is proportional with k = 3.5, and the equation is y = 3.5x.
Compare this table:
| x | y | y ÷ x |
|---|---|---|
| 1 | 5 | 5 |
| 2 | 8 | 4 |
| 3 | 11 | 3.67 |
The ratios change, so this table is not proportional, even though y increases steadily. It follows y = 3x + 2, which has a starting value of 2 when x is 0.
How to Tell if a Table Is Proportional
There are three quick tests. A proportional table passes all three.
- Constant ratio. Divide y by x in every row. If the results are all the same, the table is proportional.
- Zero gives zero. When x = 0, y must also be 0. A table with (0, 4) can’t be proportional.
- Doubling test. If one x is double another, its y should be double too. In the first table above, x = 4 is double x = 2, and y = 14 is double y = 7.
The first test is the one the calculator uses, because it works for every row at once and gives you k at the same time.
Does the Table Show a Proportional Relationship? Practice with Four Tables
School tests often ask: which table shows a proportional relationship between x and y? Here’s how to answer that kind of question in under a minute. Look at these four tables:
| Table | Pairs (x, y) | y ÷ x in each row | Proportional? |
|---|---|---|---|
| A | (1, 4), (2, 8), (5, 20) | 4, 4, 4 | Yes, k = 4 |
| B | (1, 3), (2, 5), (3, 7) | 3, 2.5, 2.33 | No |
| C | (0, 2), (1, 4), (2, 6) | — , 4, 3 | No, (0, 2) rules it out |
| D | (3, 1), (6, 2), (12, 4) | 1/3, 1/3, 1/3 | Yes, k = 1/3 |
Tables A and D show proportional relationships. Table B grows steadily but adds 2 each time instead of multiplying. Table C fails straight away, because a proportional table can’t have y = 2 when x = 0.
The same method answers questions such as which table shows a proportional relationship between weight and price? Divide each price by its weight. If every row gives the same price per kilogram, the table is proportional.
Constant of Proportionality
The constant of proportionality is the number you multiply x by to get y:
k = y ÷ x
It has a real meaning in most problems. In a table of hours worked and pay, k is the hourly rate. In a table of litres and cost, k is the price per litre. In a recipe table of cups of flour and cookies, k is the number of cookies per cup. That’s why k is also called the unit rate: it’s the value of y when x is exactly 1.
Finding k from a table
Pick any complete row and divide. With hours and pay of (3, 54), k = 54 ÷ 3 = 18 per hour. Check another row to make sure it’s the same: (5, 90) gives 90 ÷ 5 = 18 too.
Finding k from a word problem
“A car travels 150 km in 2.5 hours.” Here k = 150 ÷ 2.5 = 60 km per hour, and the equation is d = 60t.
Constant of proportionality from a table: five quick examples
| Table (x, y) | k = y ÷ x | Meaning |
|---|---|---|
| Hours and pay: (2, 36), (5, 90) | 18 | 18 per hour |
| Kilograms and price: (3, 7.50), (4, 10) | 2.50 | 2.50 per kg |
| Minutes and pages: (2, 24), (5, 60) | 12 | 12 pages per minute |
| Litres and km: (5, 80), (12, 192) | 16 | 16 km per litre |
| Cups of flour and cookies: (2, 30), (3, 45) | 15 | 15 cookies per cup |
Each constant answers the question “how much y for one x?” That’s why the constant of proportionality from a table is so useful: once you know it, you can predict any row without extending the table.
Which Equation Represents the Proportional Relationship in the Table?
This is the most common question about proportional tables, and it has a three-step answer.
- Divide y by x in any row to find k.
- Check a second row gives the same k. If it doesn’t, the table isn’t proportional and no y = kx equation fits it.
- Write y = kx with your value of k.
Example 1: whole-number constant
| x | 2 | 5 | 8 |
|---|---|---|---|
| y | 14 | 35 | 56 |
14 ÷ 2 = 7, 35 ÷ 5 = 7 and 56 ÷ 8 = 7, so k = 7. The equation is y = 7x.
Example 2: decimal constant
| x | 4 | 10 | 12 |
|---|---|---|---|
| y | 6 | 15 | 18 |
6 ÷ 4 = 1.5, 15 ÷ 10 = 1.5 and 18 ÷ 12 = 1.5. The equation is y = 1.5x.
Example 3: fraction constant
| x | 3 | 9 | 15 |
|---|---|---|---|
| y | 2 | 6 | 10 |
2 ÷ 3 = 2/3 in every row. The equation is y = (2/3)x, which you can also write as y = 2x/3.
Example 4: choosing from multiple-choice answers
A table shows (2, 5), (4, 10) and (6, 15). Which equation fits: y = 2x, y = 2.5x, y = x + 3 or y = 5x?
- k = 5 ÷ 2 = 2.5, and 10 ÷ 4 = 2.5 too.
- The answer is y = 2.5x.
- y = x + 3 works for the first row (2 + 3 = 5) but fails the second (4 + 3 = 7, not 10). That’s a common trap, so always test more than one row.
Write equations for proportional relationships from tables with real units
Give the variables real names when the table has them. A table of hours (h) and pay (p) with k = 18 becomes p = 18h. A table of litres (L) and cost (C) with k = 1.65 becomes C = 1.65L. The constant then reads as a unit rate: 18 per hour, or 1.65 per litre.
One Relationship, Four Representations
Maths classes describe the same proportional relationship in four ways. Being able to move between them is the key skill behind most proportional relationship questions.
| Representation | Example: bike rental at 4 per hour |
|---|---|
| Words | Each hour of rental costs 4. |
| Table | (1, 4), (2, 8), (3, 12), (5, 20) |
| Equation | c = 4h |
| Graph | A straight line through (0, 0) and (1, 4) |
- From words to a table: pick a few inputs and multiply each one by the rate.
- From a table to an equation: divide y by x to find k, then write y = kx.
- From an equation to a graph: plot (0, 0) and (1, k), then draw a straight line through them.
- From a graph to words: read the point where x = 1. Its y value is the unit rate.
How to Fill in Missing Values in a Proportional Table
Once you know k, every gap can be filled with one of two rules:
- Missing y: multiply. y = k × x.
- Missing x: divide. x = y ÷ k.
Example: a table has the pairs (2, 7) and (4, 14), with a missing y for x = 8 and a missing x for y = 42.
- Find k: 7 ÷ 2 = 3.5. Check: 14 ÷ 4 = 3.5.
- Missing y: 3.5 × 8 = 28.
- Missing x: 42 ÷ 3.5 = 12.
Ratio tables with labels
Ratio tables in school books are often written sideways, with a label on each row:
| Apples | 3 | 6 | 12 | ? | ? |
|---|---|---|---|---|---|
| Cost ($) | 4.50 | ? | ? | 30 | 1.50 |
The Fill Missing Values tab handles this layout. It uses the complete first column as the base, finds the multiplier for each column (× 2, × 4 and so on) and applies it to the other row. Here the cost of one apple is 4.50 ÷ 3 = 1.50, so 6 apples cost 9, 12 apples cost 18, $30 buys 20 apples and $1.50 buys 1 apple.
Strategies for Completing Ratio Tables
You don’t always need k to fill a ratio table. Classrooms teach a few mental strategies that use the same rule: whatever you do to one row, do to the other.
- Double or halve. If 4 tickets cost 30, then 8 tickets cost 60 and 2 tickets cost 15.
- Multiply by any number. From 3 cups making 12 muffins, × 5 gives 15 cups for 60 muffins.
- Add two columns. If 2 kg costs 5 and 3 kg costs 7.50, then 5 kg costs 5 + 7.50 = 12.50. Adding works because both columns share the same ratio.
- Go back to one. Divide to reach a column with 1 in it, which is the unit rate, and then multiply up to any value.
| Tickets | 2 | 4 | 6 | 8 | 10 |
|---|---|---|---|---|---|
| Cost | 15 | 30 | 45 | 60 | 75 |
You can add or multiply columns, but you can’t add the same number to both rows. Going from (4, 30) to (5, 31) by adding 1 to each breaks the ratio. That’s the most common error in ratio tables.
Horizontal and vertical tables
Some books write tables sideways, with x in the top row and y in the bottom row. Others write them in columns. The maths is the same either way: compare each x with the y directly beside or below it. In this calculator, Check a Table uses columns, and Fill Missing Values uses the sideways (two-row) layout.
How to Make a Proportional Table
If you know k, or one pair of values, you can build a whole table:
- Choose the x values. They can start anywhere and go up by any step, such as 1, 2, 3 or 5, 10, 15.
- Multiply each x by k to get y.
- Add a y ÷ x column to show that it never changes.
Example: a printer prints 12 pages per minute (k = 12).
| Minutes (x) | Pages (y) |
|---|---|
| 1 | 12 |
| 2 | 24 |
| 3 | 36 |
| 4 | 48 |
| 5 | 60 |
The Make a Table tab does this for up to 20 rows. If you start from a pair, such as 4 minutes and 48 pages, it finds k = 48 ÷ 4 = 12 first.
Graphing a Proportional Relationship
Plot the pairs from a proportional table and they always fall on a straight line through the origin, the point (0, 0). The steepness of the line is k:
- A large k (such as 10) gives a steep line.
- A small k (such as 0.5) gives a shallow line.
- The point (1, k) is always on the line, so you can read k straight off the graph.
A straight line that does not pass through the origin, such as y = 3x + 2, is linear but not proportional. A curved graph is not proportional either.
| Graph shape | Passes through (0, 0)? | Proportional? |
|---|---|---|
| Straight line | Yes | Yes, y = kx |
| Straight line | No | No, it has a starting value |
| Curve | — | No |
The calculator draws the line for every table it makes or checks, with your points marked on it.
From a graph to a table, and back
To build a table from a proportional graph, read a few points off the line, such as (1, 3), (2, 6) and (4, 12). Dividing gives k = 3 in every row, so the equation is y = 3x. To go the other way, plot each row of your table as a point. If the points line up and the line runs through (0, 0), the table is proportional. The Make a Table and Check a Table tabs draw this graph for you.
Which graph of ordered pairs shows a proportional relationship?
A set of ordered pairs shows a proportional relationship when its points sit on one straight line that passes through the origin. Points on a line that crosses the y-axis above or below zero, or points that curve, don’t show a proportional relationship.
Non-Proportional Tables: Finding the Equation Anyway
Not every table is proportional, but many are still linear: y changes by the same amount each time x goes up by 1. You can still write an equation for them, of the form y = mx + b.
- Find the rate of change (m): divide the change in y by the change in x between two rows.
- Find the starting value (b): work back to x = 0, or use b = y − mx with any row.
- Write y = mx + b.
Example: (1, 7), (2, 10), (4, 16).
- m = (10 − 7) ÷ (2 − 1) = 3.
- b = 7 − 3 × 1 = 4.
- The equation is y = 3x + 4.
Because b isn’t 0, the table isn’t proportional, even though it’s a straight line. In a proportional table, b is always 0, so y = mx + b simplifies to y = kx. This is the clearest way to see the difference between proportional and non-proportional relationships.
Inverse Proportion Tables
In an inverse proportion, y gets smaller as x gets bigger, and the product x × y stays the same:
x × y = k, so y = k ÷ x
Example: a fixed job of 60 worker-hours.
| Workers (x) | Hours (y) | x × y |
|---|---|---|
| 2 | 30 | 60 |
| 3 | 20 | 60 |
| 5 | 12 | 60 |
| 6 | 10 | 60 |
| 15 | 4 | 60 |
Every product is 60, so the table is inversely proportional with k = 60. To fill a gap, divide k by the known value: 6 workers need 60 ÷ 6 = 10 hours.
How to calculate inverse proportion from a table
- Multiply x by y in every complete row.
- If all the products match, call that number k.
- Find a missing y with y = k ÷ x, or a missing x with x = k ÷ y.
Example: a tank empties in 12 minutes with 2 pumps. With pumps and minutes as (2, 12), (3, 8) and (4, ?), the products are 24 and 24, so k = 24 and 4 pumps take 24 ÷ 4 = 6 minutes.
The graph of an inverse proportion is a curve that drops steeply at first and then flattens out. It never touches either axis, because x × y can’t equal 60 when either value is 0.
Direct or inverse? A side-by-side check
| Test | Direct proportion | Inverse proportion |
|---|---|---|
| What stays the same | y ÷ x | x × y |
| Equation | y = kx | y = k ÷ x |
| When x doubles | y doubles | y halves |
| Graph | Straight line through (0, 0) | Curve that never meets the axes |
| Example | Hours worked and pay | Workers and days for a fixed job |
Proportional or Not? Spotting It in an Equation
An equation shows a proportional relationship when it can be written as y = kx with nothing added or subtracted:
| Equation | Proportional? | k |
|---|---|---|
| y = 7x | Yes | 7 |
| y = x ÷ 4 | Yes | 1/4 |
| y = 0.8x | Yes | 0.8 |
| y = 3x + 1 | No (has + 1) | — |
| y = x² | No (curve) | — |
| xy = 20 | Inverse, not direct | 20 |
Tables with Fractions
The constant of proportionality doesn’t have to be a whole number. In a recipe that uses 2 cups of sugar for every 3 cups of flour, the table of flour (x) and sugar (y) has k = 2/3.
| Flour (x) | Sugar (y) | y ÷ x |
|---|---|---|
| 3 | 2 | 2/3 |
| 6 | 4 | 2/3 |
| 4 1/2 | 3 | 2/3 |
| 7 1/2 | 5 | 2/3 |
Keeping k as the exact fraction 2/3, rather than 0.67, avoids rounding errors. The calculator works with exact fractions behind the scenes, so it can tell that 3 ÷ 4.5 is exactly 2/3.
Proportional Relationship Table Examples by Subject
Proportional tables show up far beyond maths class.
Science: density. A metal block keeps the same density, so its mass is proportional to its volume.
| Volume (cm³) | 10 | 20 | 50 |
|---|---|---|---|
| Mass (g) | 27 | 54 | 135 |
k = 2.7 g per cm³ in every column, which is the density of aluminium.
Money: exchange rates. At a fixed rate of 278 rupees per dollar, a table of dollars and rupees is proportional with k = 278. So 50 dollars buys 13,900 rupees.
Cooking: scaling a recipe. A pancake mix uses 150 g of flour for every 2 eggs.
| Eggs | 2 | 4 | 6 |
|---|---|---|---|
| Flour (g) | 150 | 300 | 450 |
k = 75 g of flour per egg.
Travel: steady speed. A train at 90 km/h covers 45 km in half an hour, 90 km in 1 hour and 225 km in 2.5 hours. Distance ÷ time = 90 in every row.
Using Tables to Compare Two Rates
Proportional tables make comparisons easy, because the constant k is a unit rate. Put two tables side by side and compare their k values.
Example: Shop A sells 3 kg of apples for 7.50. Shop B sells 5 kg for 11.50.
- Shop A: k = 7.50 ÷ 3 = 2.50 per kg.
- Shop B: k = 11.50 ÷ 5 = 2.30 per kg.
Shop B is cheaper per kilogram. On a graph, Shop B’s line would be slightly less steep, because a lower k gives a shallower line.
The same idea compares speeds (km per hour), fuel economy (km per litre) and wages (pay per hour). Whichever table has the larger k gives more y for each unit of x.
Proportional Tables in Real Life
- Unit pricing: litres of fuel and total cost.
- Recipes: servings and grams of each ingredient.
- Speed: time and distance at a constant speed.
- Wages: hours worked and pay at a fixed hourly rate.
- Currency: dollars and the equivalent amount in another currency at a fixed exchange rate.
- Science: mass and volume of a substance with constant density (k is the density).
Tables that look proportional but aren’t include phone plans with a monthly fee, taxi fares with a starting charge and gym memberships with a joining fee. Each has a fixed amount added on, so y isn’t zero when x is zero.
Worked Examples
Example 1: is the table proportional?
Distance (km) against time (hours): (1, 45), (2, 90), (4, 180).
Divide: 45 ÷ 1 = 45, 90 ÷ 2 = 45, 180 ÷ 4 = 45. All the same, so the table is proportional. The car travels at a steady 45 km per hour, and the equation is d = 45t.
Example 2: complete the table
A garden centre sells mulch by the bag. 4 bags cost 26. Fill in the cost of 10 bags and the number of bags for 52.
- k = 26 ÷ 4 = 6.50 per bag.
- 10 bags: 6.50 × 10 = 65.
- Bags for 52: 52 ÷ 6.50 = 8.
Example 3: not proportional
A plumber charges (1 hour, 90), (2 hours, 140), (3 hours, 190).
Divide: 90, 70, 63.3. The ratios change, so the table is not proportional. The cost goes up by 50 an hour, but there’s a fixed call-out fee of 40 (90 − 50), so the equation is y = 50x + 40.
Example 4: inverse table
A 240 km trip: speed (km/h) and time (hours) are (60, 4), (80, 3), (120, 2). The products are all 240, so time is inversely proportional to speed. At 96 km/h the trip takes 240 ÷ 96 = 2.5 hours.
Proportional Relationships in the Grade 7 Curriculum
In the Common Core standards used in many US schools, proportional relationships are a core topic in Grade 7 (7.RP.A.2). Students learn to:
- decide whether two quantities are in a proportional relationship, for example by testing for equivalent ratios in a table or graphing on a coordinate plane and checking for a straight line through the origin;
- identify the constant of proportionality (unit rate) in tables, graphs, equations, diagrams and written descriptions;
- represent proportional relationships with equations such as t = pn, where t is the total cost, p is the price per item and n is the number of items;
- explain what a point (x, y) on the graph means, especially the points (0, 0) and (1, r), where r is the unit rate.
Every tab of the proportion table calculator lines up with these skills. Students can test tables, find k, write y = kx and see the graph with (0, 0) and (1, k) marked by the line.
For Teachers and Parents
The proportion table calculator works well as a classroom tool:
- Answer keys: enter a worksheet’s tables to check every k and every missing value in seconds.
- Make new practice tables: use Make a Table with a new k, a starting value and a step, and you have a fresh table and graph to print.
- Show the pattern: project the y ÷ x column so students see the constant appear in every row.
- Discuss mistakes: enter a non-proportional table and let students explain why the ratios change.
- Link tables and graphs: the graph appears under every answer, so students connect a constant ratio with a straight line through the origin.
Students get the most from the calculator when they predict the answer first, then use the tool to check it.
Common Mistakes
- Checking only one row. One pair always gives a k. You need at least two complete rows to know whether a table is proportional.
- Dividing the wrong way. k is y ÷ x, not x ÷ y. Both are constant in a proportional table, but the equation y = kx needs y ÷ x.
- Confusing “increasing” with “proportional”. A table can rise steadily without being proportional, as with y = 3x + 2.
- Rounding too early. Keep fractions like 2/3 exact until the end, or a correct table can look as if it isn’t proportional.
- Mixing units in one column, such as minutes in some rows and hours in others.
Practice Questions
| Question | Answer |
|---|---|
| Is (3, 12), (5, 20), (8, 32) proportional? | Yes, k = 4 |
| Is (2, 9), (4, 16), (6, 23) proportional? | No, y ÷ x changes |
| y = 2.5x. Find y when x = 14. | 35 |
| k = 6. Find x when y = 51. | 8.5 |
| x × y = 48. Find y when x = 12. | 4 |
| Write the equation for (5, 2), (10, 4), (25, 10). | y = 0.4x |
| Which is proportional: (1, 6), (2, 12) or (1, 6), (2, 10)? | The first, k = 6 |
| Fill the ratio table: 3 pens cost 4.50, so 7 pens cost ? | 10.50 |
Frequently Asked Questions
How do you know if a table is proportional?
Divide y by x in every row. If every result is the same, the table is proportional and that number is the constant of proportionality k.
How do you find the constant of proportionality from a table?
Pick any complete row and divide y by x. Check a second row to be sure it gives the same value.
What is a proportional table?
It’s a table of x and y values where every y is the same multiple of its x, so y ÷ x is constant and the values fit y = kx.
How do you fill in a proportional table?
Find k from a complete row. Then multiply k by x to find a missing y, or divide y by k to find a missing x.
What does a proportional relationship look like on a graph?
A straight line that passes through the origin (0, 0). The point (1, k) is always on the line.
Can a proportional table include 0?
Yes, but only the pair (0, 0). If x is 0 and y is not, the table isn’t proportional.
What is the difference between a ratio table and a proportional table?
They work the same way. A ratio table usually lists two labelled quantities in rows, such as apples and cost, while a proportional table usually lists x and y in columns. Both have a constant ratio.
What is an inverse proportion table?
A table where x × y gives the same number in every row. As x increases, y decreases, and the values fit y = k ÷ x.
Is a linear table always proportional?
No. A linear table has a constant difference between rows, but it is only proportional if it also passes through (0, 0), so that y ÷ x is constant.
Why is k called the unit rate?
Because k is the value of y when x is 1, such as the cost of one item or the pay for one hour.
Which equation represents the proportional relationship in the table?
Divide y by x in each row. If you get the same number k every time, the equation is y = kx. For the table (2, 5), (4, 10), (6, 15), k = 2.5, so the equation is y = 2.5x.
Does the table show a proportional relationship?
It does if y ÷ x is the same in every row and the pair (0, 0) would fit. If the ratios change, or y isn’t 0 when x is 0, the table is not proportional.
How do you find a proportional relationship on a table?
Add a column for y ÷ x. A proportional relationship shows up as the same number in every row of that column.
What is the constant of proportionality in a table?
It’s the value of y ÷ x that stays the same in every row. It tells you how much y you get for each 1 of x.